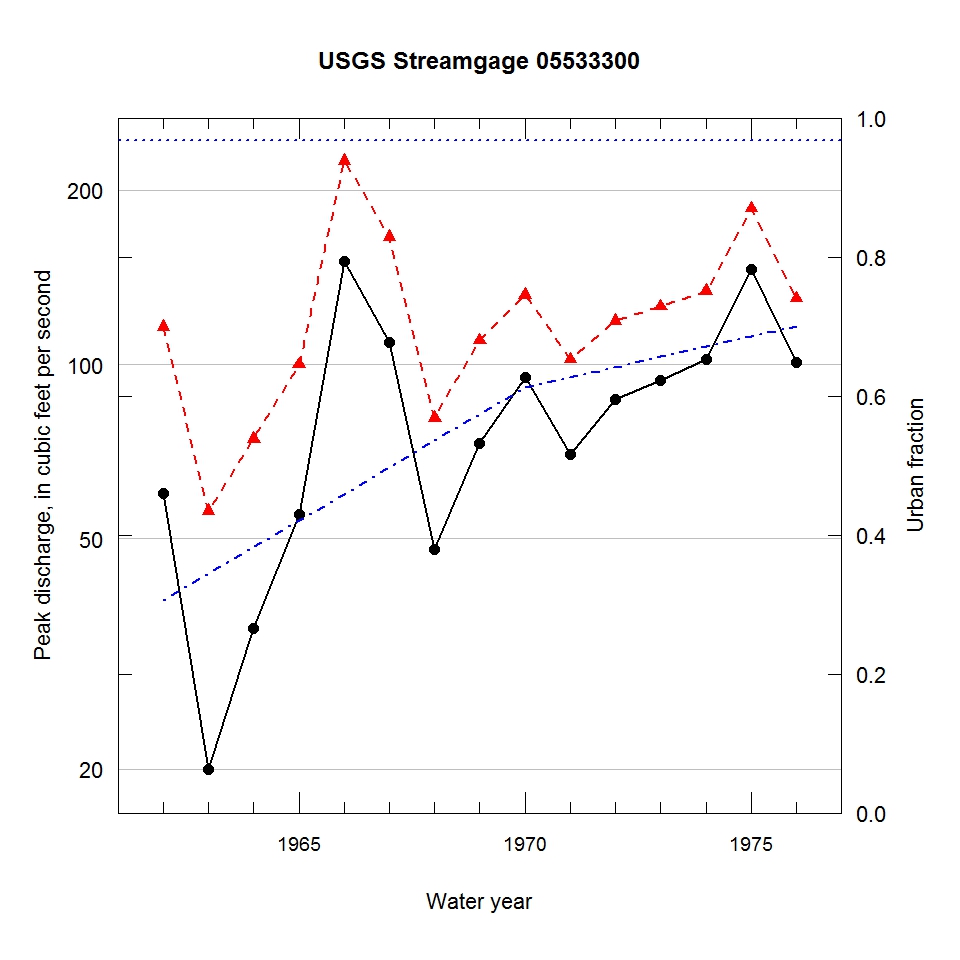
Observed and urbanization-adjusted annual maximum peak discharge and associated urban fraction and precipitation values at USGS streamgage:
05533300 WARDS CREEK NEAR WOODRIDGE, IL


| Water year | Segment | Discharge code | Cumulative reservoir storage (acre-feet) | Urban fraction | Precipitation (inches) | Observed peak discharge (ft3/s) | Adjusted peak discharge (ft3/s) | Exceedance probability |
| 1962 | 1 | -- | 0 | 0.306 | 0.420 | 60 | 116 | 0.289 |
| 1963 | 1 | 2 | 0 | 0.344 | 1.400 | 20 | 56 | 0.922 |
| 1964 | 1 | -- | 0 | 0.382 | 1.510 | 35 | 74 | 0.745 |
| 1965 | 1 | -- | 0 | 0.421 | 0.980 | 55 | 100 | 0.449 |
| 1966 | 1 | -- | 0 | 0.459 | 4.121 | 151 | 225 | 0.026 |
| 1967 | 1 | -- | 0 | 0.497 | 1.180 | 109 | 166 | 0.084 |
| 1968 | 1 | -- | 0 | 0.536 | 3.071 | 48 | 81 | 0.665 |
| 1969 | 1 | -- | 0 | 0.574 | 1.741 | 73 | 110 | 0.348 |
| 1970 | 1 | -- | 0 | 0.612 | 1.300 | 95 | 132 | 0.186 |
| 1971 | 1 | -- | 0 | 0.627 | 0.560 | 70 | 102 | 0.438 |
| 1972 | 1 | -- | 0 | 0.642 | 3.301 | 87 | 119 | 0.257 |
| 1973 | 1 | -- | 0 | 0.656 | 2.171 | 94 | 126 | 0.214 |
| 1974 | 1 | -- | 0 | 0.671 | 1.611 | 102 | 134 | 0.179 |
| 1975 | 1 | -- | 0 | 0.686 | 2.301 | 146 | 186 | 0.053 |
| 1976 | 1 | -- | 0 | 0.701 | 4.381 | 101 | 130 | 0.196 |

